In this report, I will be exploring data from the Hass Avocado Board (HAB) and the Kaggle Avocado Price (2020) data set. The focus of this project is to compare prices of avocados in Tampa vs Miami, Florida and to showcase my experience writing complex queries.
Downloaded data contained the following fields:
| Volume Data Projections(from HAB) |
Avocado Prices (From Kaggle & merged with HAB) |
| week |
date |
| year |
average price |
| status |
total volume |
| total volume |
plu4046 |
| California |
plu4225 |
| Chile |
plu4770 |
| Mexico |
total bags |
| Peru |
small bags |
| Colombia |
large bags |
| Dominican Republic |
xlarge bags |
| - |
type |
| - |
year |
| - |
region |
Data Cleaning
- Combined the most recent (2021) price data from Hass to the Kaggle database using EXCEL
- Combined Volume Data Projects from 2019- 2022 into one table using EXCEL
- Corrected capitalization in the ‘type’ column to reflect the Kaggle dataset
- Filtered and removed all regions except Tampa, Miami and TotalUs
While cleaning, I noticed several issues with the datasets. For instance, small, large and xlarge bag size values were missing from 2018-2020. Historical volume import data was limited to 2019 and beyond, while price data stretched back to 2015. The import volume data for 2022 is constantly updating, while the price data for the first quarter of 2022 is not available for comparison at this time. These discrepancies led me to focus solely on price.
To view the SQL code with this report, visit:
sjphilippe github
Avocado Hypothesis
Initially, I assumed that Miami would have lower avocado prices due to the heavy Caribbean and Hispanic influence in South Florida. In my experience, most houses in South Florida grow fruiting trees, including mango, papaya and avocado. I’ve personally had home grown avocados from a family tree towering well over 20 feet. With this information, I believed that the readily local supply of avocados would compete with those imported. Instead, I found that avocados are actually less expensive in Tampa compared to Miami.
Organic vs Conventional Price Analysis
I first wanted to see when avocado prices in Tampa and Miami were above or below the US average. To accomplish this, I created a CTE to separate the US region from Florida regions. I then assigned conditions to the specific cases I wanted to compare against. I’ve added comments under the WHERE clause to explain how to adjust the query for specific outputs. The query is as follows:
WITH table1 AS (SELECT ROUND(avg_price,2) AS usavg, date, type
FROM florida_avo
WHERE region = 'TotalUS')

SELECT region, fa.date, usavg, ROUND(avg_price,2) AS city_price, t1.type,
CASE WHEN fa.avg_price < usavg THEN 'Below'
	WHEN fa.avg_price > usavg THEN 'Above'
	ELSE 'Matching' END AS price_flux
FROM florida_avo AS fa
JOIN table1 AS t1
ON t1.date = fa.date
	AND t1.type = fa.type
WHERE
	-- t1.type = 'organic' AND --> filter by type of avo(organic/conventional)
	region != 'TotalUS' AND -- excludes total us AS region value
	region = 'Tampa' AND -->filter by region(s). exclude to show all.
	 year BETWEEN '2019' AND '2021'
ORDER BY fa.date, region
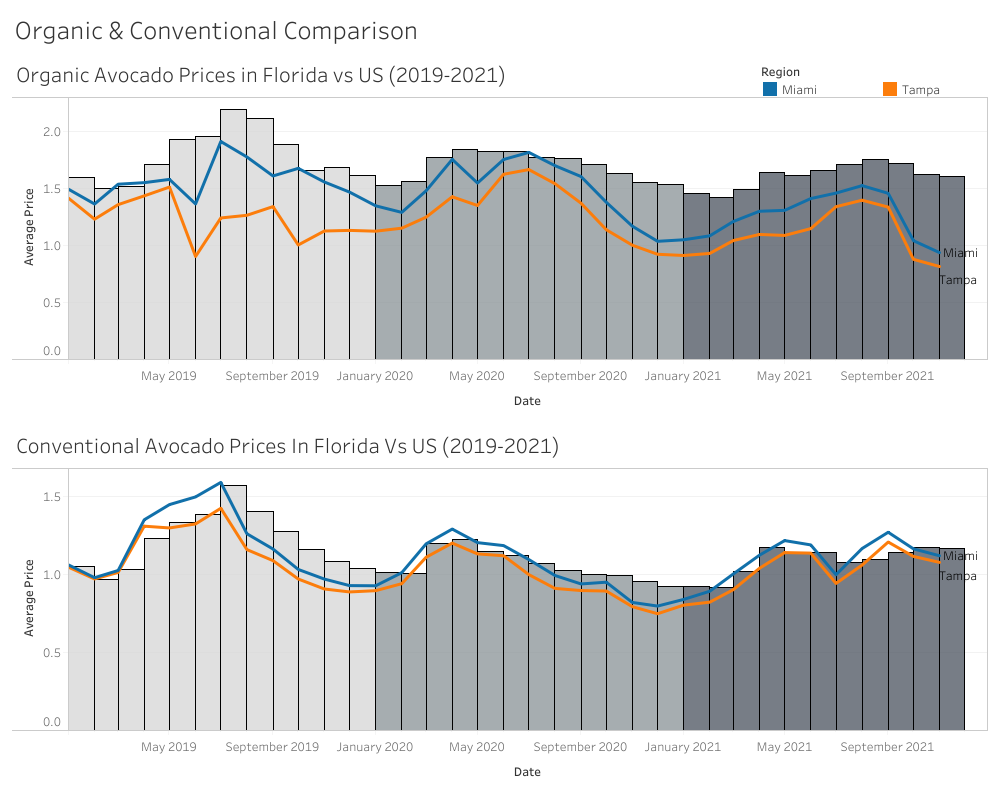
In the image below, Tampa avocado prices from 2019 - 2021 have always been priced lower than Miami for both organic and conventional avocados. There are noticeable price patterns, with price increasing the second quarter of the year, followed by a sharp decrease in the third and fourth quarter. The graph also shows that organic avocado price in South Florida is frequently below US average, while conventional avocado prices tend to be above the US average in the second yearly quarter.
To quantify how often prices in Tampa/Miami are above US average, I took the above query and modified it by adding the main query as a second CTE. I then used arithmetic operators to find the percentage that avocado prices were below the US average per year. The query is as follows:
WITH table1 AS (SELECT ROUND(avg_price,2) AS usavg, date, type
FROM florida_avo
WHERE region = 'TotalUS'),

table2 AS (SELECT region, fa.date, usavg, ROUND(avg_price,2) AS city_price, t1.type, year,
CASE WHEN fa.avg_price < usavg THEN 'Below' END AS pricebelow,
CASE WHEN fa.avg_price > usavg THEN 'Above' END AS priveabove,
CASE WHEN fa.avg_price = usavg THEN 'Matching' END AS sameprice
FROM florida_avo AS fa
JOIN table1 AS t1
ON t1.date = fa.date
	AND t1.type = fa.type
WHERE
	region != 'TotalUS' AND --> excludes total us AS region value
	year BETWEEN '2019' AND '2021' --> filter by year here
ORDER BY fa.date, fa.region)

SELECT distinct region, year,
	count(priveabove)/2 AS timesabove_usavg, --> count()/2 because query counts organic & conventional prices AS separate weeks.
	count(pricebelow)/2 AS timesbelow_usavg,
	count(sameprice)/2 AS timesmatching_usavg,
	count(pricebelow)/2*100/(count(priveabove)/2 + count(pricebelow)/2) AS perc_below_usavg
FROM table2
GROUP BY region, year
ORDER BY region, year
The above query revealed that avocado prices in Tampa were below US average for 90%, 94% and 91% of the year in 2019, 2020, and 2021 respectively. For comparison Miami prices were below US average for 72%, 75% and 72% of the year in 2019, 2020, and 2021.
Price vs Import Analysis
Avocado prices showed the greatest increase in price during 2019. To explore why, I queried the volume data projections table. The goal was to compare avocado imports vs avocado sales to illustrate any patterns that may influence price. To create this query, I first created a CTE that focused on US sales. I then joined the CTE to the volume projection data and specified the cases when weekly US sales exceeded weekly imports. The query:
WITH chart1 AS (SELECT
region, date,
sum(total_vol) OVER
			(PARTITION BY date ORDER BY region) AS sumavo
FROM florida_avo
WHERE region = 'TotalUS')

SELECT t.week, region, t.total_vol AS imported, ROUND(sumavo,0) AS sold, Round(t.total_vol- sumavo,0) AS difference,
CASE WHEN sumavo > t.total_vol THEN 'oversold'
	WHEN sumavo < t.total_vol THEN 'undersold' END AS outcome
FROM chart1 AS c
JOIN total_volume AS t
ON t.week = c.date
GROUP BY t.week, region, t.total_vol, sumavo
ORDER BY t.week
Avocado sales exceeded imports thirteen times between 2019 - 2021. The most noticeable weeks include:
- February 3, 2019
- February 10, 2019
- February 2, 2020
- February 9, 2020
- March 29, 2020
- April 5, 2020
- April 12, 2020
- February 7, 2021
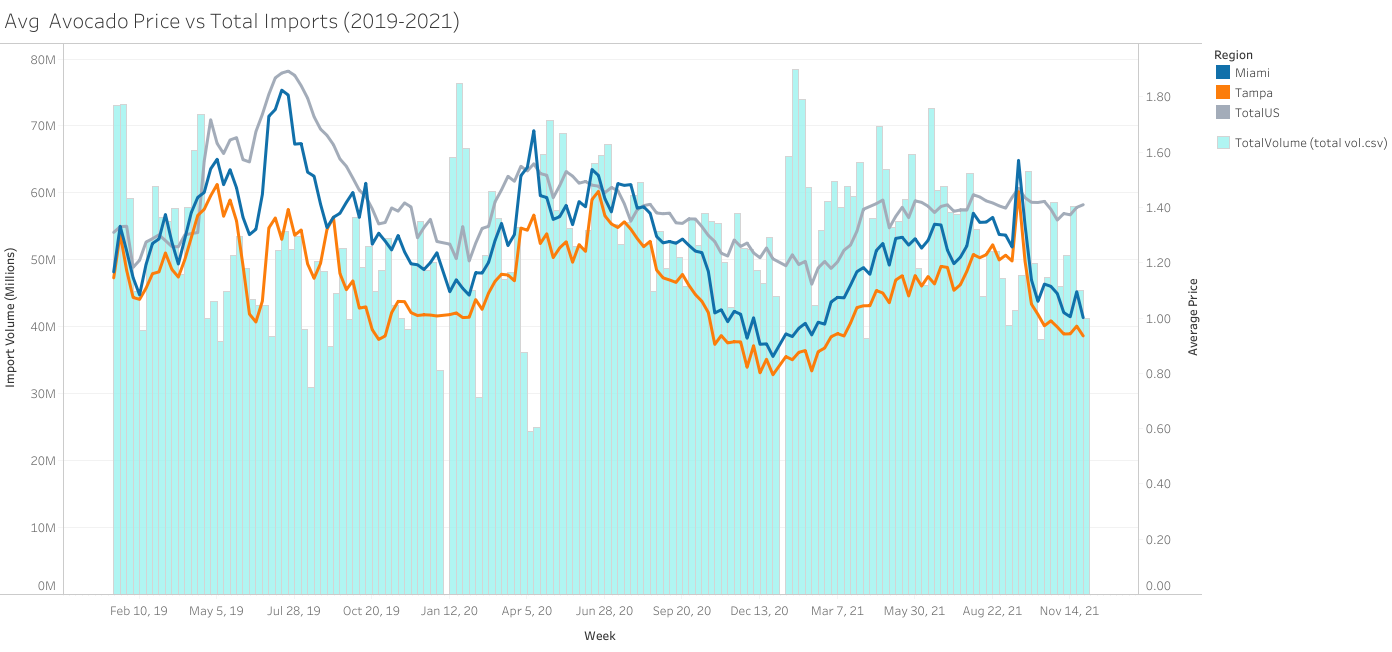
The graph below illustrates weekly avocado imports and price fluctuations for the Total US, Tampa, and Miami. Based on graphical patterns, it seems that imports are the greatest during January, but drastically fall in February (around the Superbowl) and towards the end of the first quarter as sales remain the same. April of 2020 has the lowest avocado imports at around 25 million, which created the obvious spike in prices across the US causing Miami prices to skyrocket above the US average.
Conclusion
As stated in my initial hypothesis, avocados prices are lower in Tampa vs Miami. In general, avocados in South Florida are less expensive compared to the US average with avocados being cheaper at least 70% of the year.
I enjoyed exploring the data set and the challenges it presented when creating more complex queries due to how the data was organized. Future plans with this data set:
- How the Mexican import ban in February 2022 affected avocado prices
- Compare the Hass Avocado Board’s projected volume imports with its actual imports
- Compare North and South Florida city volume consumption and price
- Explore organic avocado market share growth
- Compare volume imports to harvesting season
To view the SQL code with this report, visit:
sjphilippe github